Tapescan, my own TradingView
This post was co-authored with Grok 4.6.
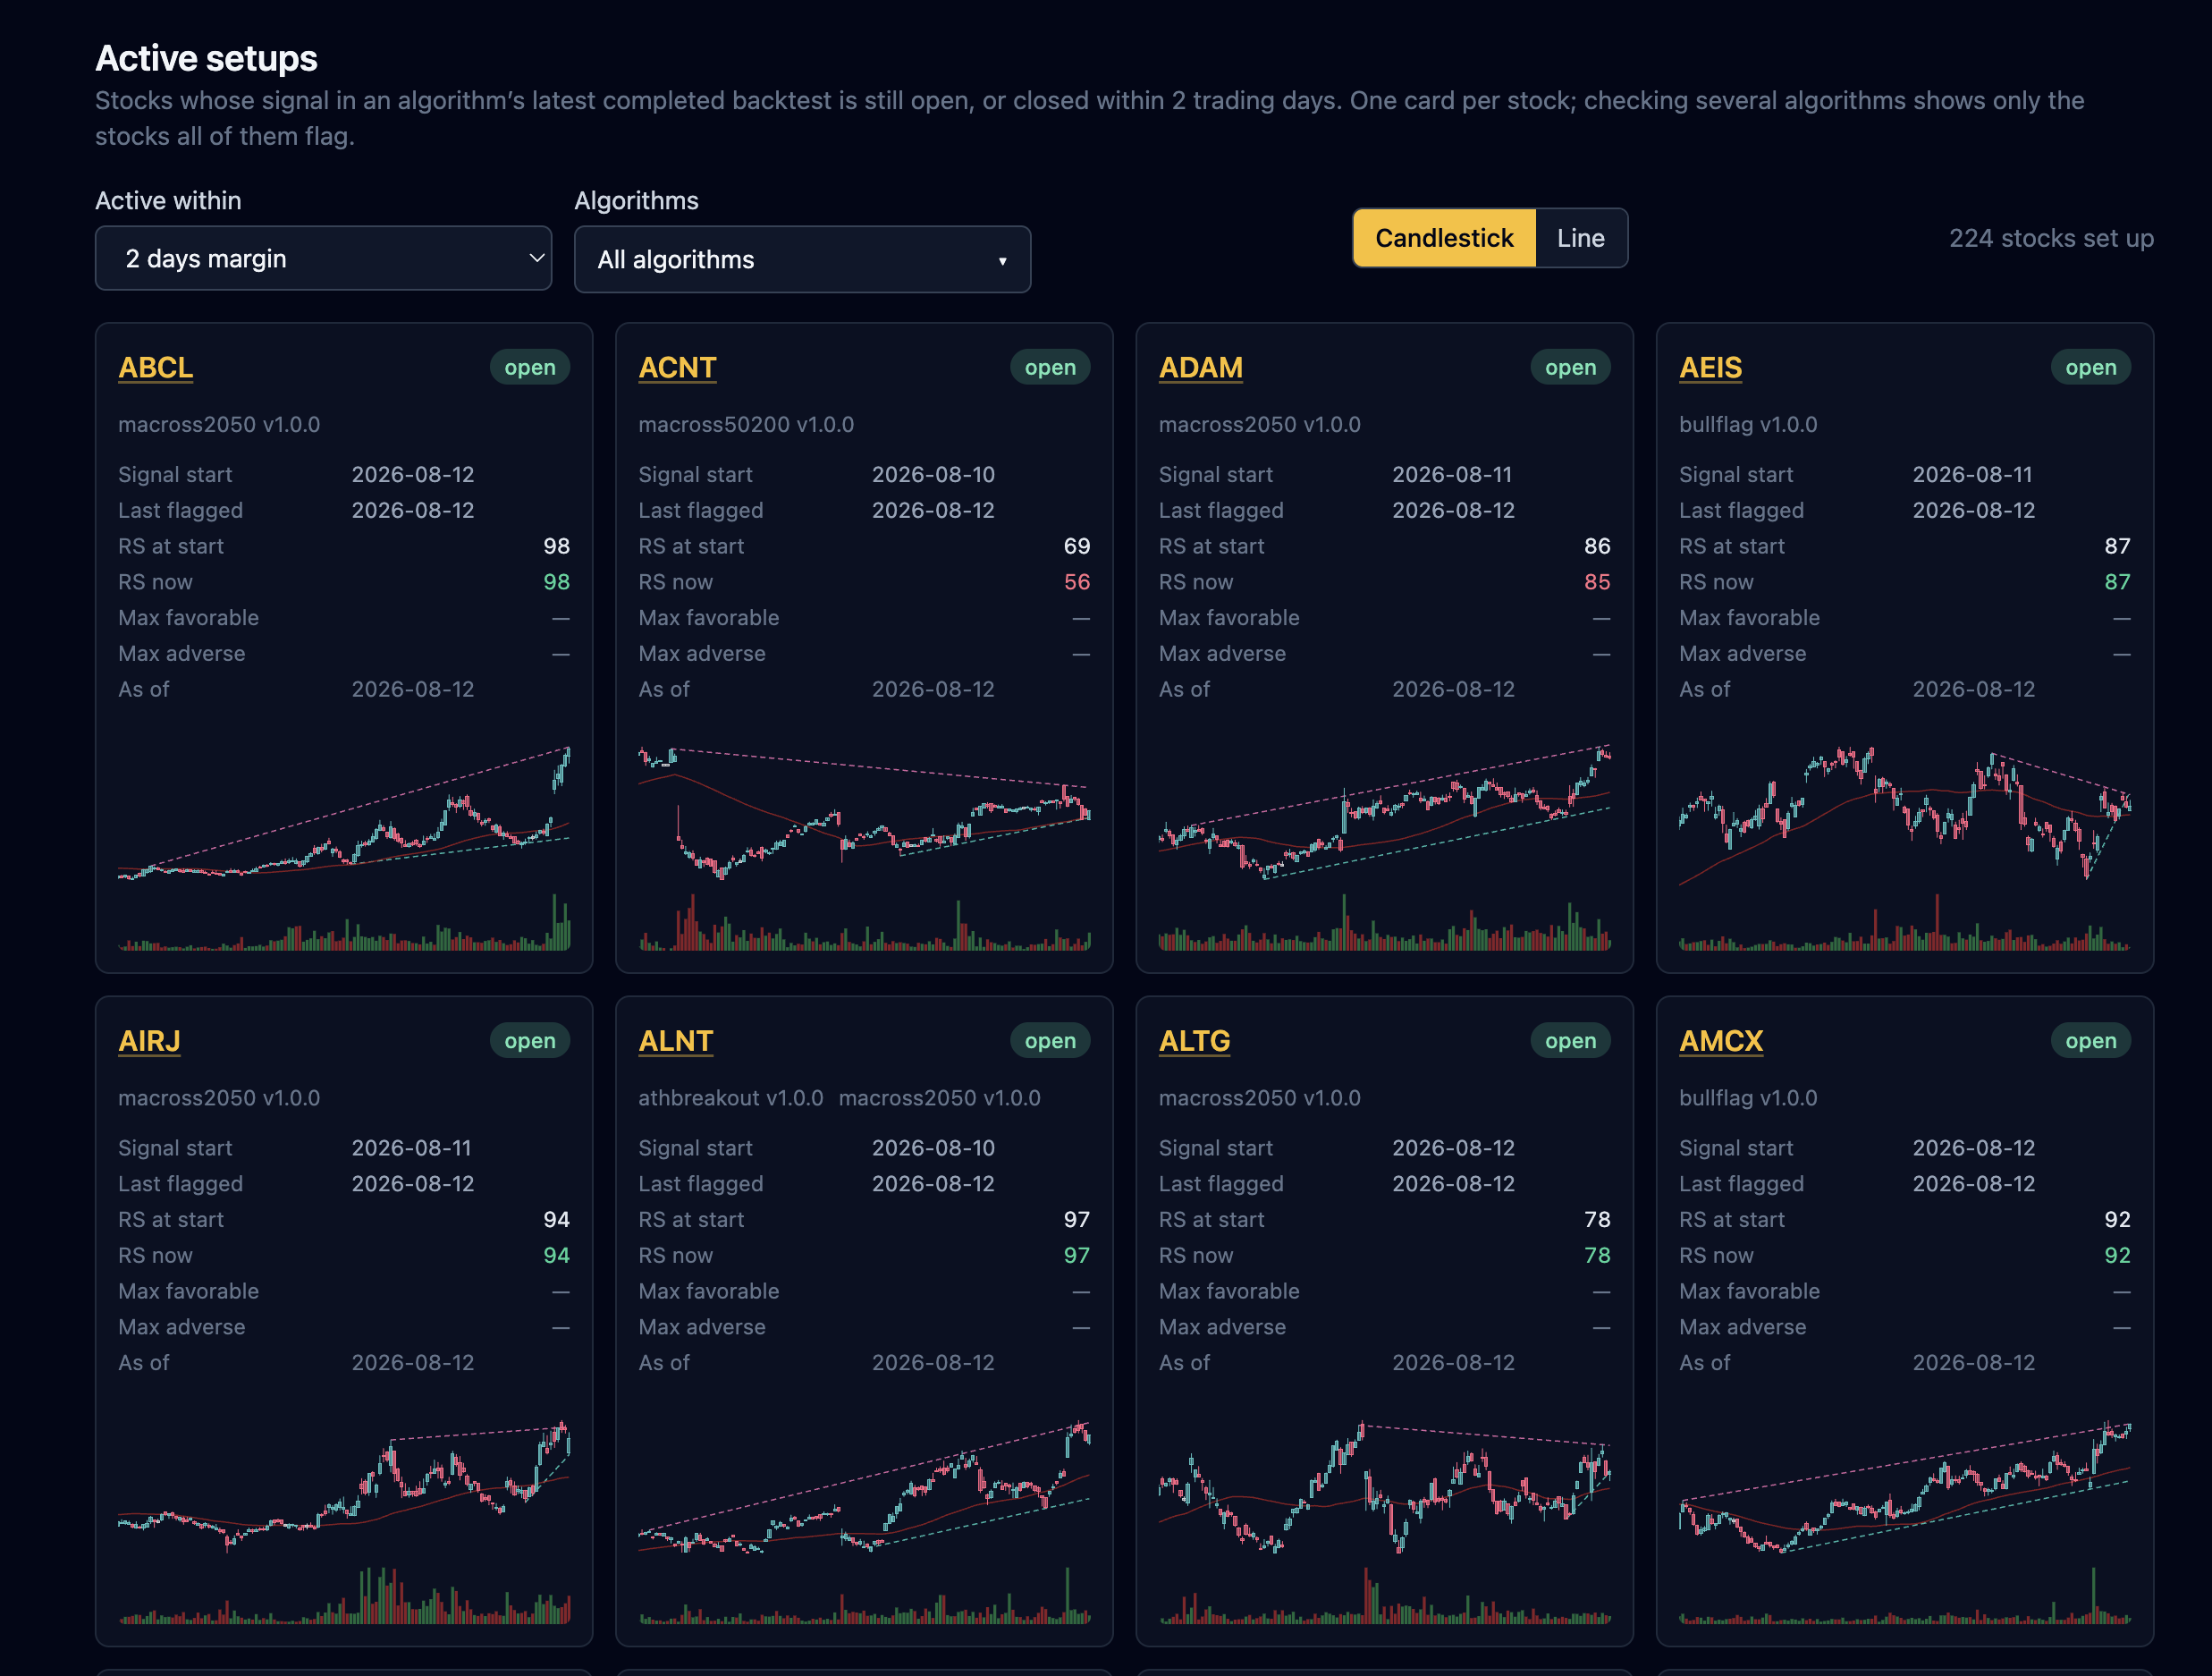
Over the last month, on my free time, I built Tapescan, a self-hosted scanner for the U.S. stock market. I used frontier models like Claude Opus and GPT 5.6 to plan, then implemented many of the tasks with lighter models too. Spec-driven development made that practical: at plan time each task already has a model assigned by complexity. Spend the expensive reasoning where the design is hard, keep the rest cheap. The product is still mine: the rules, the algorithms, and the way I actually look at the tape.
This is not a TradingView clone and it does not try to be. It is a daily end-of-day system that ingests the whole U.S. equity universe, runs my own setups overnight, and shows me only the names that match.
Why
I do not have time to scan the tape every day. Commercial platforms are fine for drawing on a chart, but I never found a clean way to drop in the exact algorithms I wanted, keep two years of history, and replay those rules over the past without paying another subscription for every extra idea.
As an engineer I also wanted something I fully control. Self-hosting is already how I run this blog and the rest of my homelab. A market scanner that I can read, change, and restart with one command fits that same habit.
I built it with spec-driven development (SDD): constitution, then spec, then plan, then tasks, then code. When a task is written it already says which model should run it. Opus for algorithm math and hard design, a lighter model for scaffolding, plumbing, and tests.
Architecture
The source of truth is historical end-of-day bars. Market providers are configurable: the rest of the app only talks to a generic contract on my side, so I can add as many providers as I want without leaking their types or ids into the domain. Bars arrive already split-adjusted and are stored as-is in Postgres. The only recurring cost today is that database: a lowest-tier GCP Postgres instance. Everything else runs on my homelab.
The system is a TypeScript monorepo that comes up with docker compose up:
Market provider (EOD bars)
        │
        ▼
   ┌─────────┐        ┌──────────┐
   │ fetcher │──bars─▶│ Postgres │◀─signals┐
   └─────────┘        └──────────┘         │
                           ▲         ┌──────────┐
                           │         │ analyzer │
                        ┌─────┐      └──────────┘
                   ┌───▶│ api │◀──────────┘
                   │    └─────┘
              ┌─────────┐
              │   web   │
              └─────────┘
- fetcher pulls the daily tape and can backfill history on demand.
- analyzer runs each algorithm as a hot-swappable module. Adding a new one does not touch the schema, the API, or the other algorithms.
- api is a small Express service for the universe, price history, live signals, and backtests.
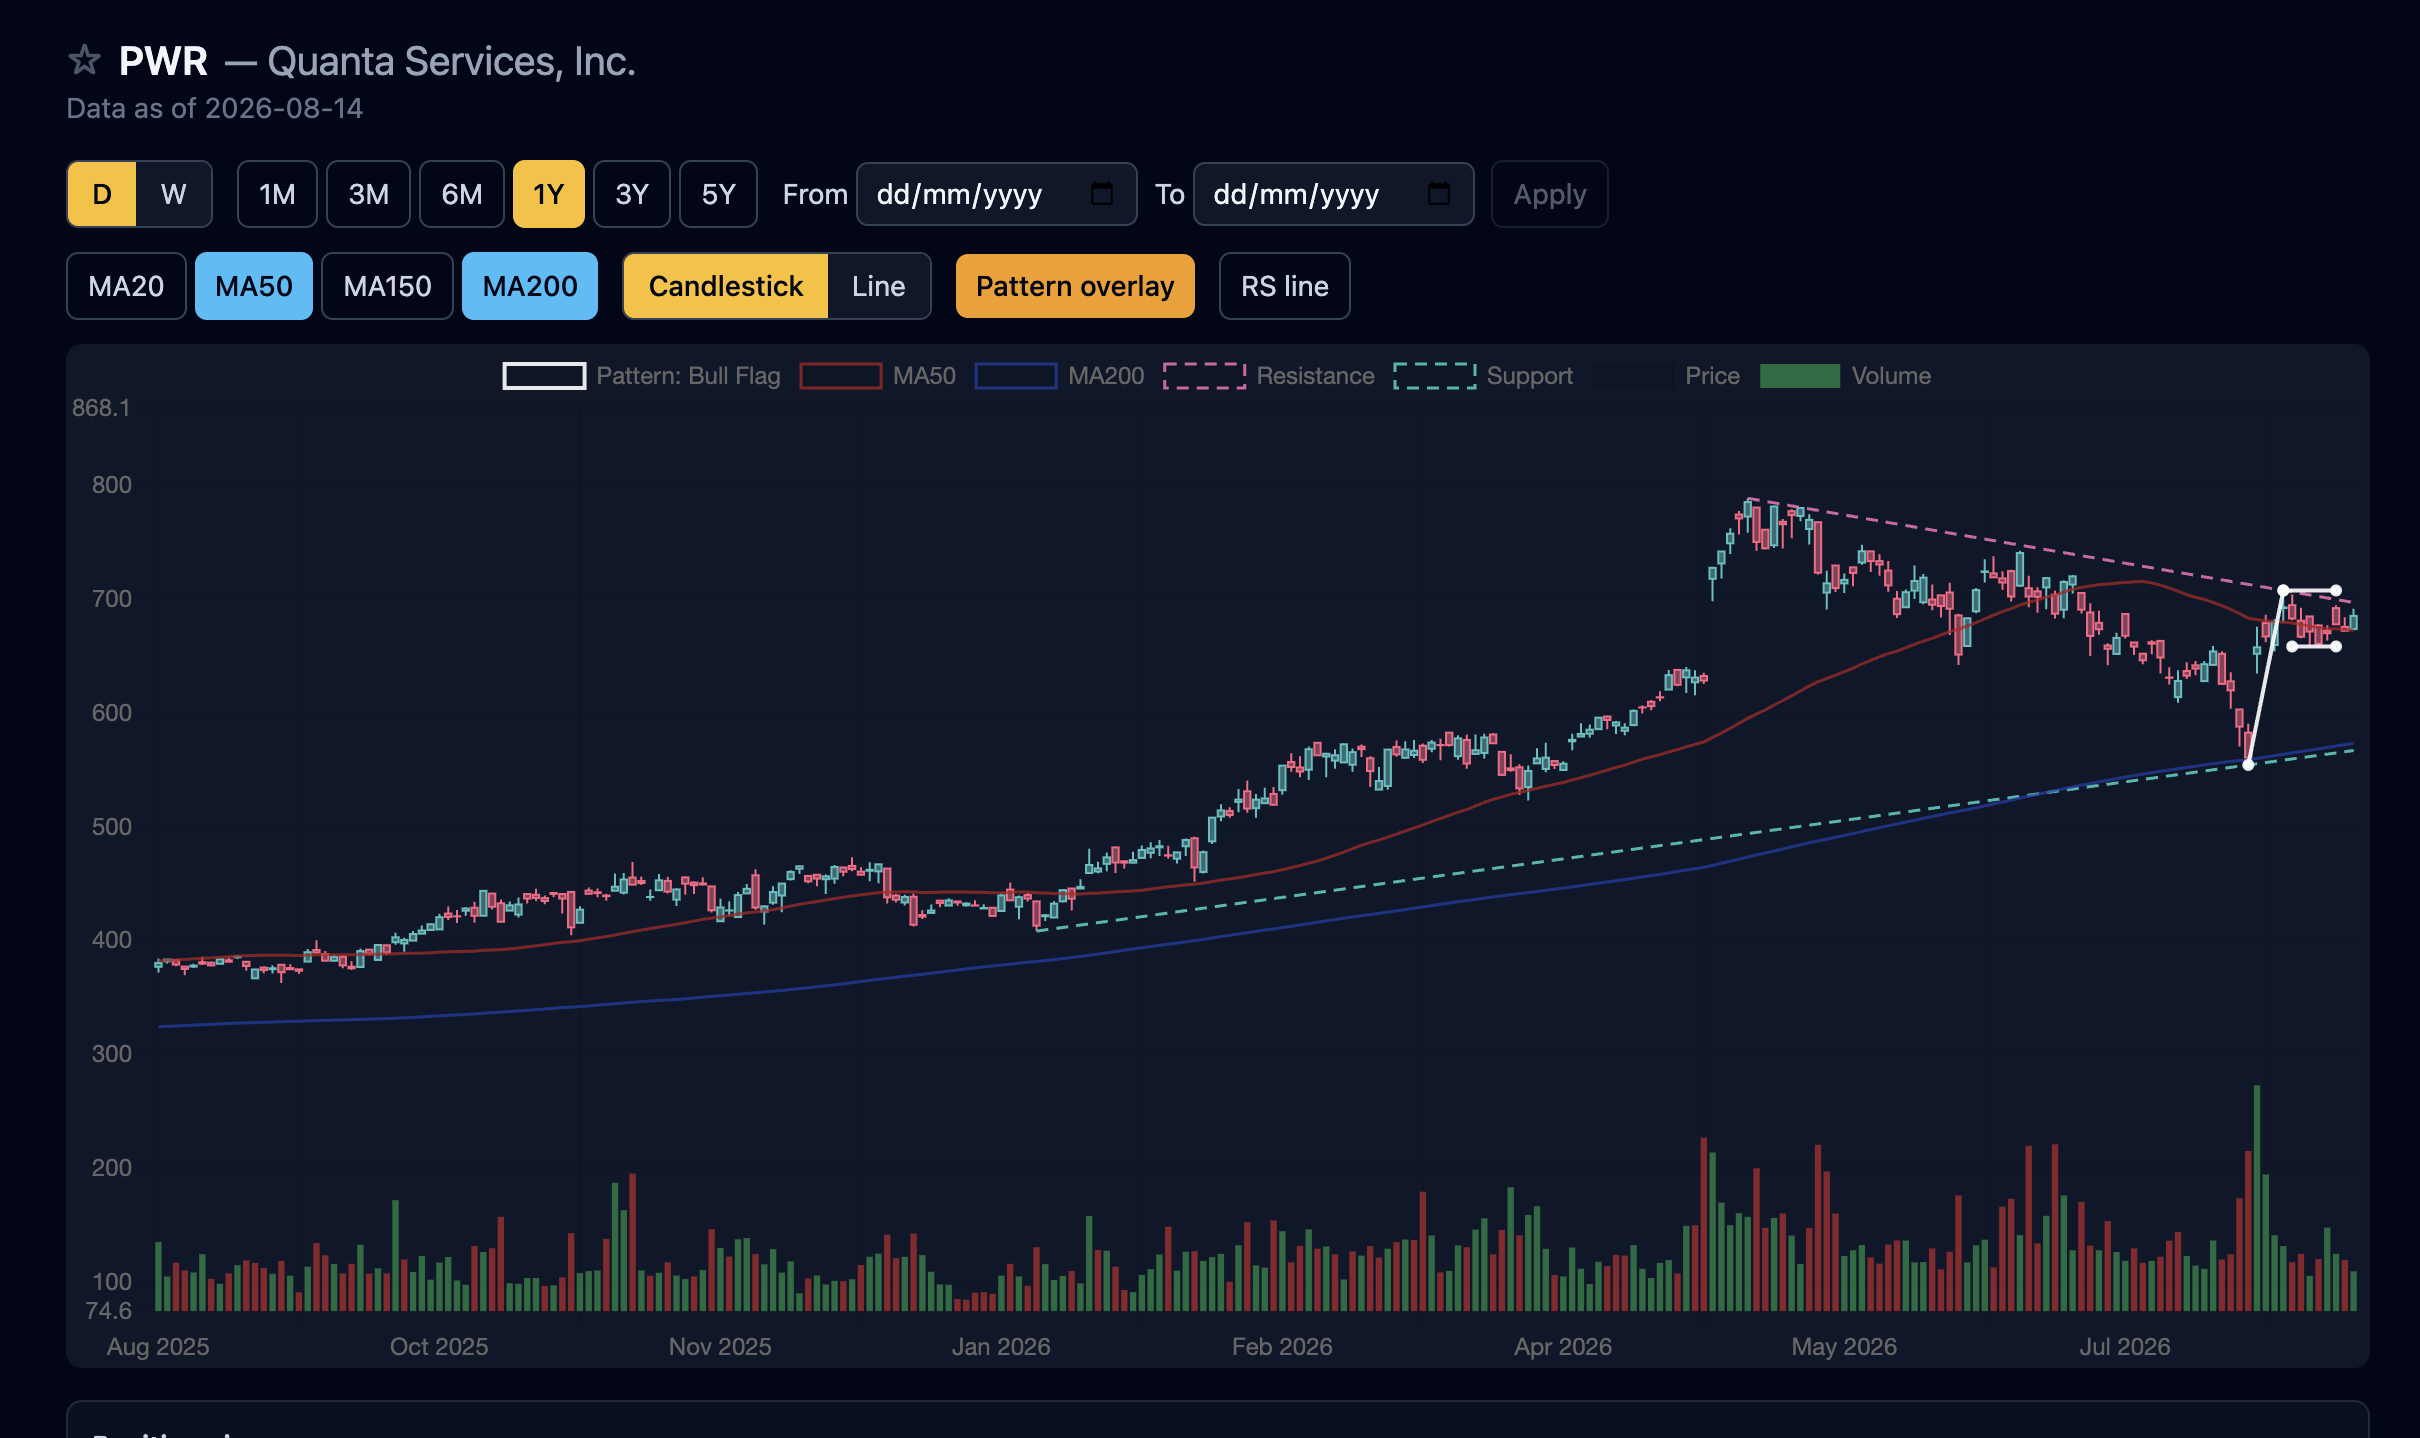
- web is a Next.js app: a searchable table, a symbol chart with moving averages and shaded signal bands, algorithm parameters, and backtest runs.
The invariants live in a constitution: open source on the critical path, one-command bring-up, deterministic algorithm tests. Every change still has to trace back to a requirement.
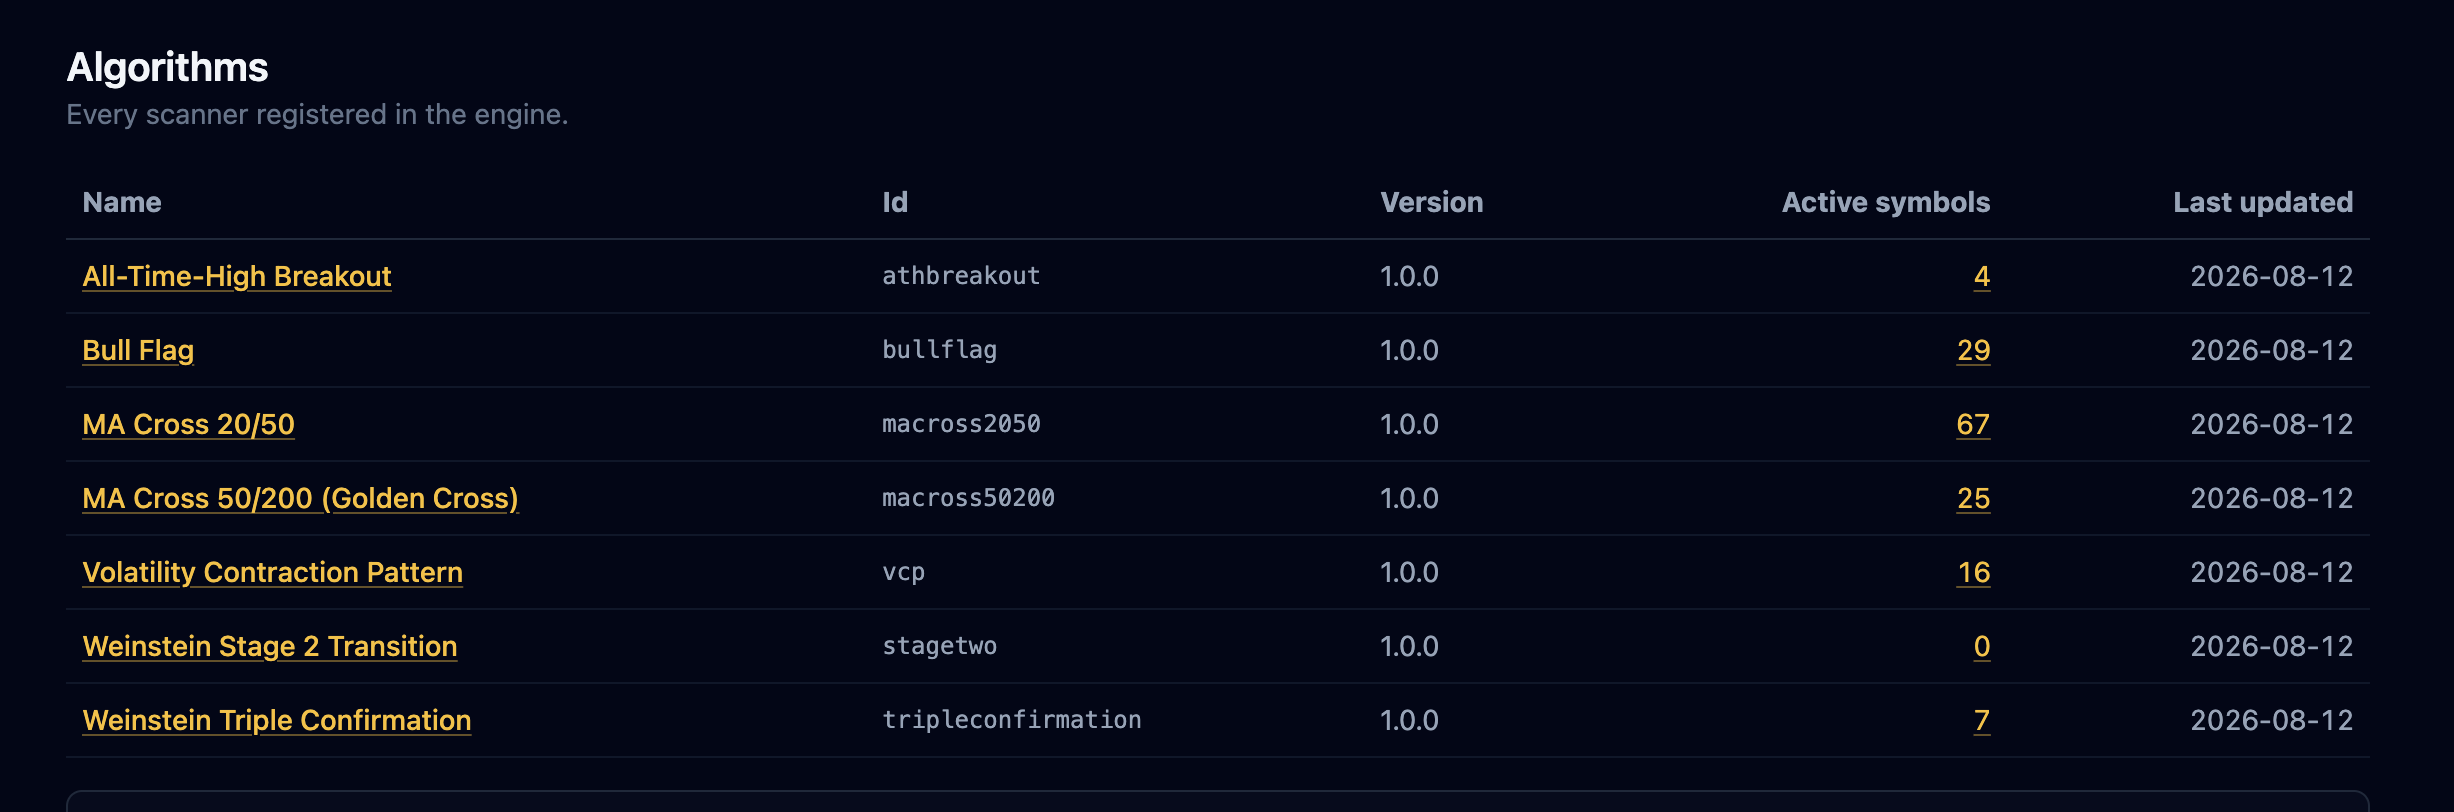
Seven modules ship today. Some look for compression before a move, others confirm after it:
- VCP — Minervini's Volatility Contraction Pattern, plus the Trend Template.
- Bull Flag — a sharp advance, then a short low-volume pause.
- Weinstein Triple Confirmation — a Stage 2 breakout already underway, with volume and relative strength agreeing.
- All-Time-High Breakout — a close above the stored history, on volume that stands out, minus the ones that already failed.
- Stage 2 Transition — the session a name crosses back above its long average out of a Stage 1 base. Earlier and looser than Triple Confirmation, on purpose.
- MA Cross 20/50 and MA Cross 50/200 — the same detector, two stored configurations.
The nightly scan does not just say "flagged right now". It maintains a live run per algorithm: open a signal, refresh it, or close it, and fill forward returns when those horizons become reachable.
Backtesting
I can replay any algorithm over the stored history as if the scanner had been running the whole time. Each run records the algorithm version and the exact parameter set, then measures what happened after each signal: fixed-horizon forward returns, best and worst excursion while the signal was open, hit rate, average and median return.
That is enough to throw away a bad idea before I stare at it every morning. It is not a brokerage simulator. There is no portfolio equity curve, no commissions, no slippage, and no automatic parameter sweep. I compare runs myself. I can also replay a single symbol from its page without waiting on the whole universe.
How I actually use it
This is a tool for me. I do not want a product to maintain for other people. I want a morning that does not depend on how I feel.
Overnight the same rules already ran on the whole tape. I open the names that are set up, confirm the chart, and I am done hunting. I do not rebuild a watchlist from memory.
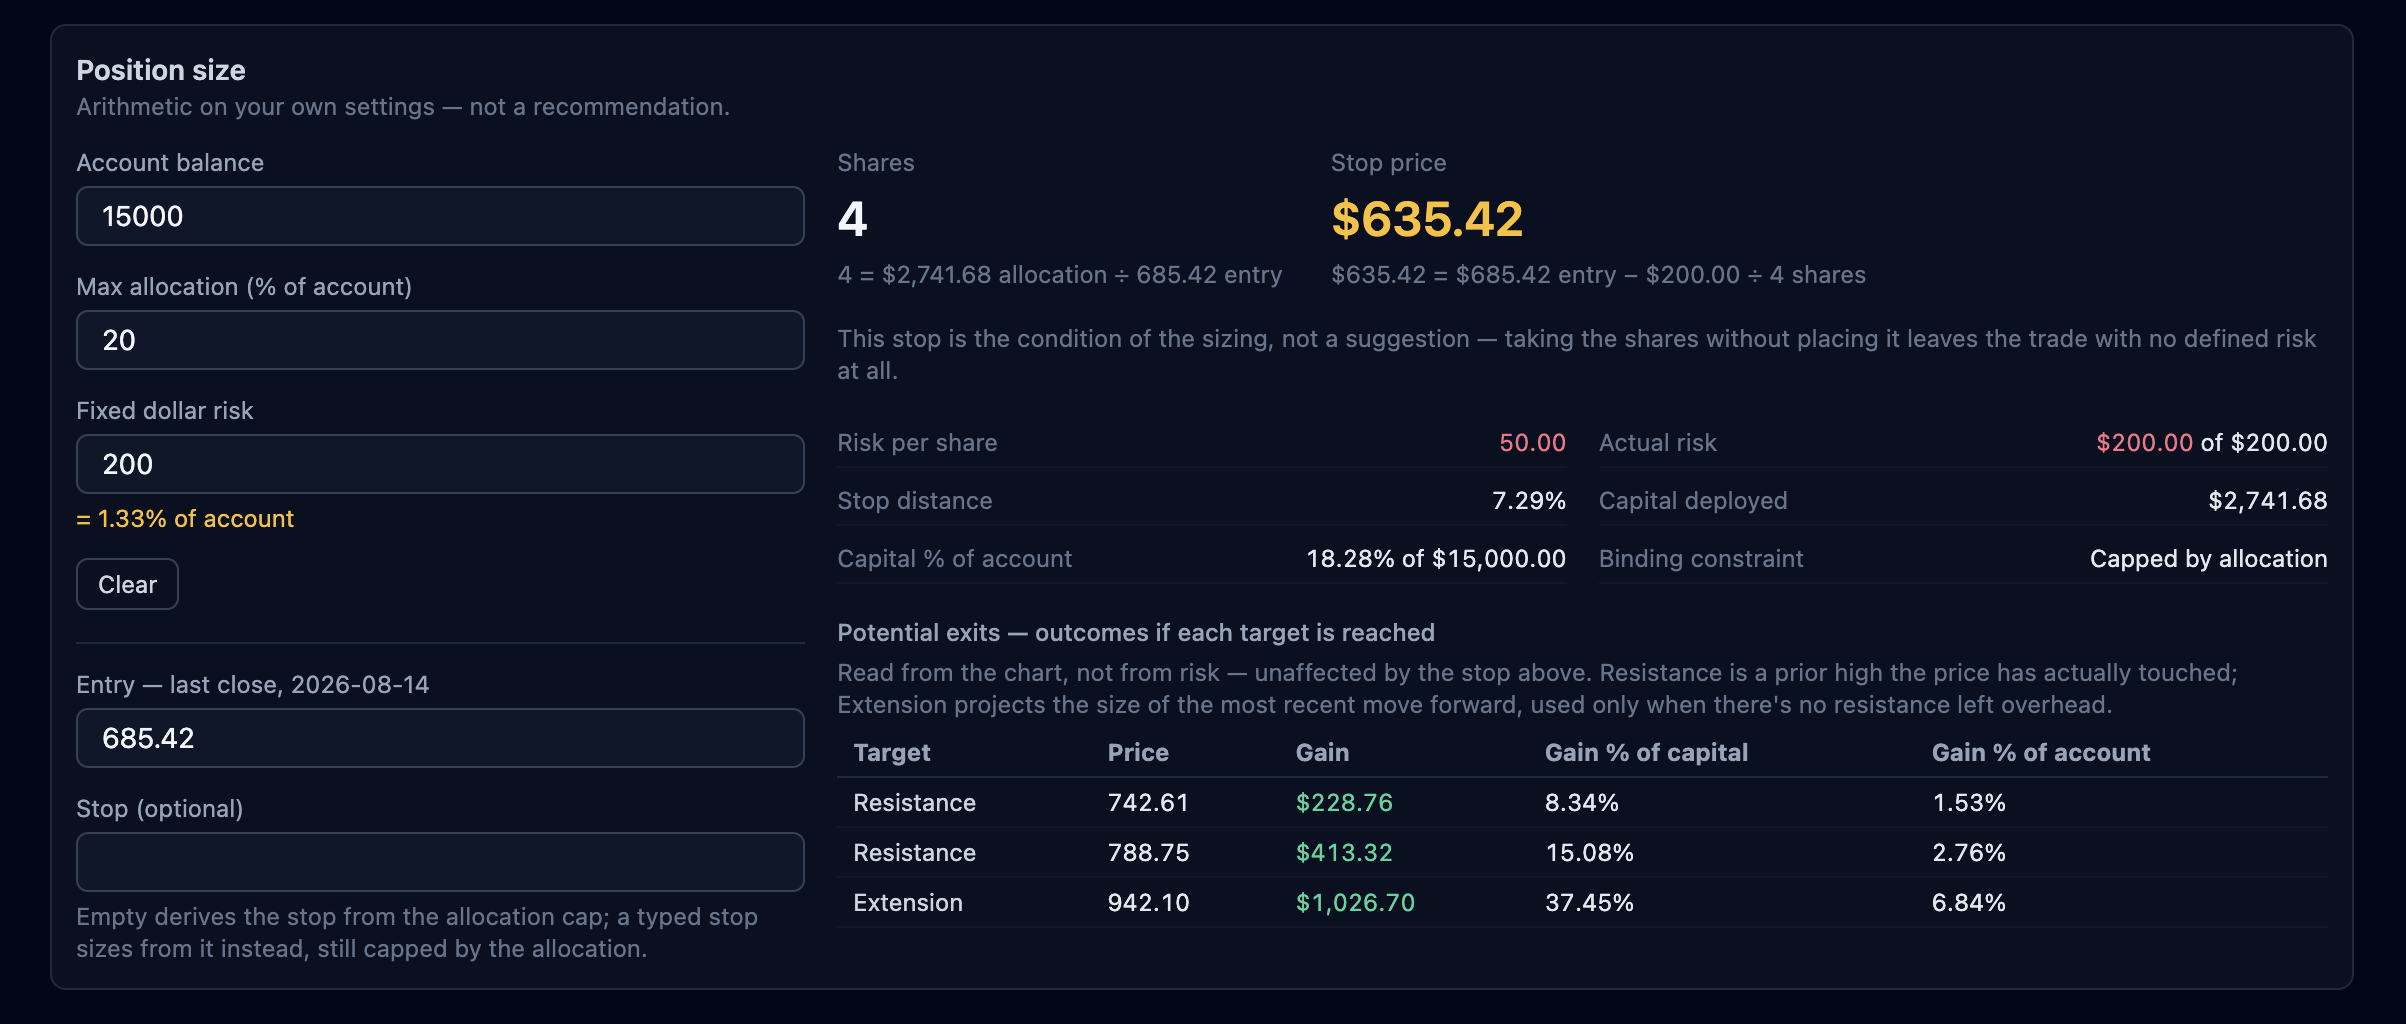
Under the chart I size the trade before I get attached to the name. Account risk is decided once. For each setup I can place the stop myself, or let the app set one from the most I am willing to lose. Either way I see the size immediately. I do not resize because a candle looks strong, and I do not skip the stop because I am late.
The scanner answers "is this set up". The sizer answers "how do I manage the risk". I just follow both.
Real world use
I am already trading these setups with real money. The useful part is not a magic win rate. It is that I spend less time hunting, I take less discretionary risk, I see the same rules applied to the whole tape every night, and I can measure a change before I trust it.
What may come
I still have to decide if I want this public, or open source. For now it is just for me, and for a few friends who care about the market. That is enough. If I open it later, it will be because the tool is already useful, not because I need an audience to finish it.
Some app features in action
Single stock with setup chart
Risk and position sizing
Algorithms
If you like this post, don't forget to say hi.

